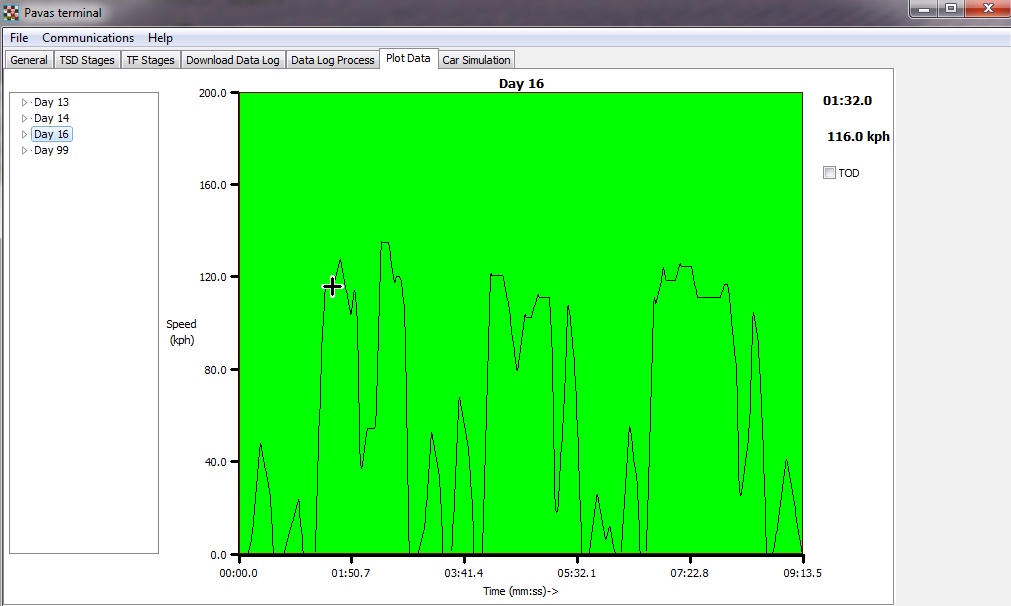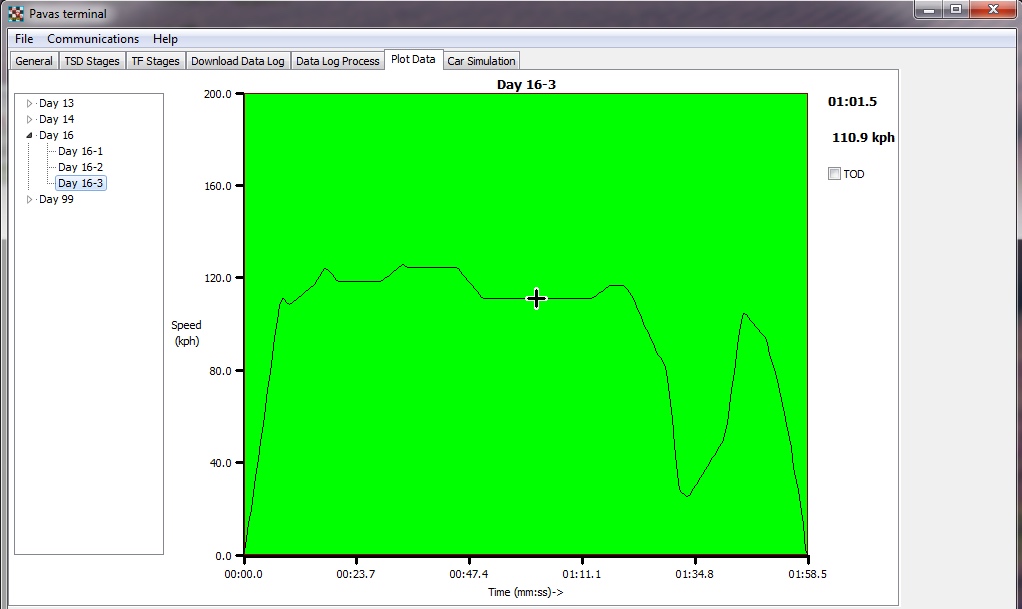
A Tree View shows the Day datalog files that have been processed. In this example the, day has been selected. This produces a plot of all the data for the day. If it exceeds 4096 samples then another section can be scrolled in by two chevron buttons that appear at the top of the view. A cursor position can be set by clicking on the plot display. The cursor values are displayed in the top right corner. The Time of Day (TOD) check box allows the time axis to display the elapsed time in the stage or the time of day that the data was collected. In this example, the short stages are evident where the vehicle was maneuvering to the stage position location.
